
pyPFC GUI
pypfc_gui is a small graphical tool for browsing and inspecting pyPFC HDF5 output. It is intended for basic visualization and post-processing, not for setting up or running simulations.
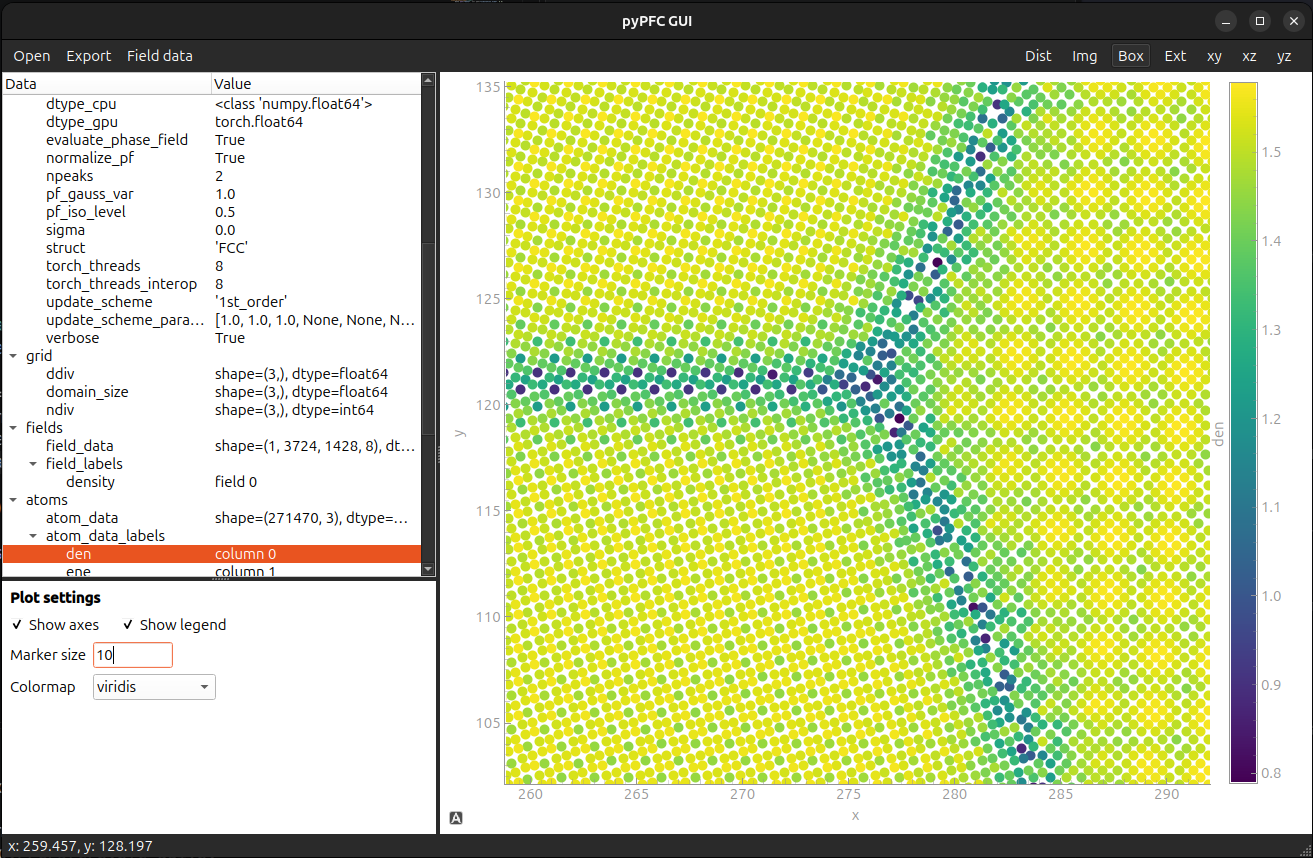
Opening and viewing data
Click Open to select an HDF5 (.h5) file. Its contents are shown in the tree on the left. Select a field label to display a 2D slice of that field, or select atom coordinates or an atom-data label to display the atom positions. Three-dimensional fields can be viewed in the xy, xz, or yz plane; the GUI shows a central slice.
Plot settings allow axes and the color legend to be shown or hidden, atom marker size to be changed and the colormap to be selected. Use the mouse to pan or zoom. Dist measures the distance between two clicked points, Box zooms into a dragged rectangle and Ext restores the full plot extent. Img saves the current plot as PNG or TIFF.
Exporting and evaluating data
Click Export to export one or more HDF5 files to Extended XYZ (atom data), VTK/VTP (atom data), or VTK/VTS (field data). Files without the data required by the chosen format are skipped.
When a loaded file contains field data, Field data opens Evaluate data. Choose a density field and calculate energy density, chemical potential or grand potential energy. Optionally enable Do atom interpolation to find density maxima and add interpolated atom positions to the tree. Calculated fields and interpolated atom data are temporary GUI results; they are not written back to the source HDF5 file.
Launch
From the pyPFC repository root, launch the application with: